Online study search behaviour and student enrolments: how strong is the link?
Analysing the Relationship Between Studyportals’ Data and HESA’s International Student Enrolments for UK Master’s Degrees
Over the past years, online search has become a key part of how we make decisions: we research new products and services online, we use our phones to identify the closest post office, to find the best restaurants for a dinner with friends, purchase gifts and books, but more increasingly, also to make complex decisions such as where and what to study.
Almost 2.4bn people used a smartphone last year, and it’s expected that by the end of 2018, more than a third of the global population will be using one (approx. 54% of all mobile users are smartphone users). The line between digital and offline decisions is becoming increasingly blurry, as the two are no longer seen as distinct, but rather continuously interacting perceptions that reinforce each other.
What does this mean in terms of study choice? Google estimated back in 2012 that 9 out of 10 students in the US were researching their study options online. Globally, the overall number might be a bit lower if we consider the uneven access to the Internet in rural parts of developing countries. When it comes to preference however, there’s no doubt that young adults these days like to start their study search online. Against this backdrop, we wanted to see to what extent can online search predict future enrolments.
Studyportals websites saw 30 million prospective students in 2017. At the same time, we know that, currently, there are only about 5 million enrolled international students globally. What is the correlation between students browsing digitally for study degrees, and the actual enrolment rates?
To better investigate this link, we decided to investigate one particular market: UK. We took an in-depth look at the data from the UK Higher Education Statistics Agency (HESA), and more specifically at its postgraduate enrolment numbers over the past years, and compared it with our data from Mastersportal. What did the data tell us?
- The data did confirm our assumption that our page view data is representative for international student enrolments for UK Master’s degrees, to a great extent.
- The more student traffic we have from a specific source country, the more reliable the data and our enrolment rank correlation.
- There’s a really strong relationship between certain disciplines and the relative ratio of student interest for that specific discipline: In 65% of all source countries for UK Master’s degrees, Business & Management is the most popular discipline in terms of student enrolments. The number of page views on Mastersportal suggests the same: in 68% of all countries of origin for the UK, Business & Management is the most popular discipline.
If you would like to understand how we came to the above conclusions, read along as we dive deeper into this data journey, taking you from how we initially explored the data, to how we did data modelling, rank correlations, how we chose our statistical research methods and everything else in-between.
Step 1: Exploring the data
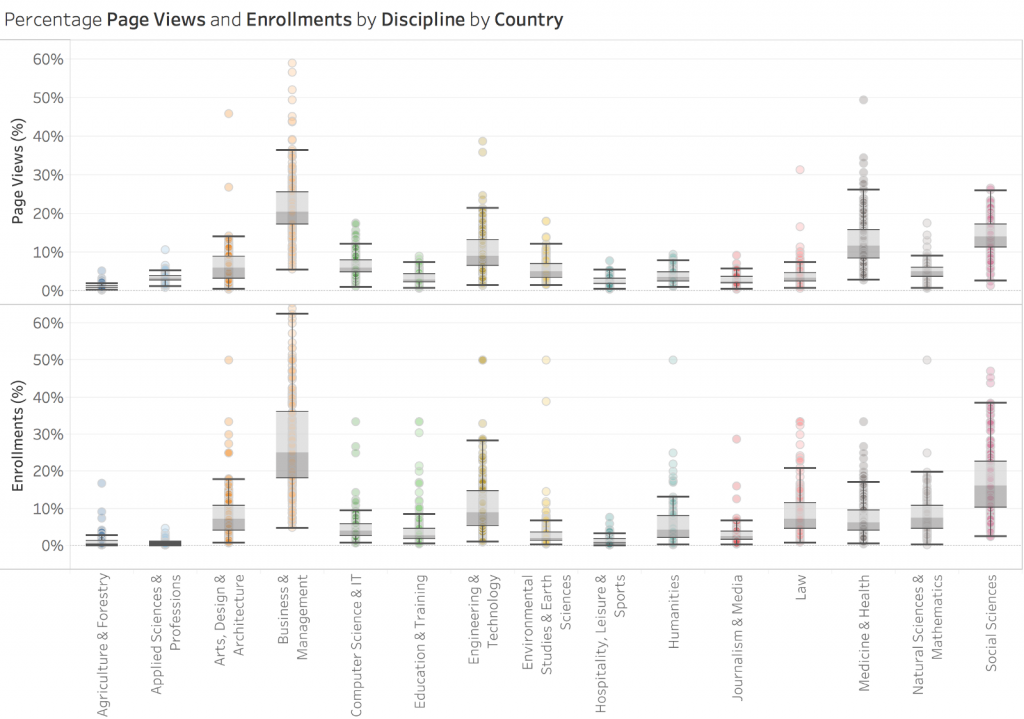
Before we dive right into the mathematics, let’s first have a look at the percentage of page views and enrolments across all countries of origin for UK postgraduate enrolments. The boxplots below give a representation of this distribution where each dot indicates a different country of origin. A visual inspection tells us that there are differences within and between disciplines. For example, the percentage of page views for Business & Management Master’s programmes in Austria is 27% whereas in Ireland it is only 9%. In the same way, the percentage of page views for Business & Management is, generally speaking, higher for Business & Management programmes than for Agriculture & Forestry ones.
Step 2: Data Modelling
Even though we can already see that disciplines with a relatively high percentage of page views typically also make up a significant proportion of total enrolments, we now want to combine both dimensions in a single figure. The corresponding data modelling process has been illustrated in a step-by-step fashion below:
Step 3: Rank Correlation
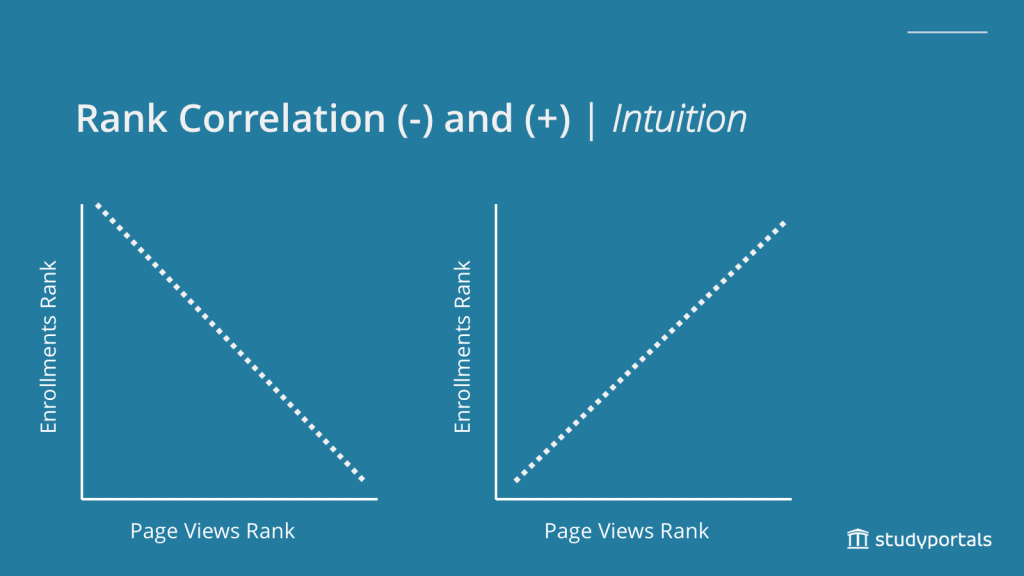
The previous section demonstrated that the trendline for all data points combined shows a positive relationship between page views and enrolments. Now, we want to numerically express to what extent this relationship holds on a country by country basis. As such, the rank correlation for each of the 203 countries of origin will be calculated. The rank correlation is always between -1 and +1 and denotes a negative (left) or positive (right) relationship respectively. Given the Data Modelling section, for most countries, a positive rank correlation is to be expected.
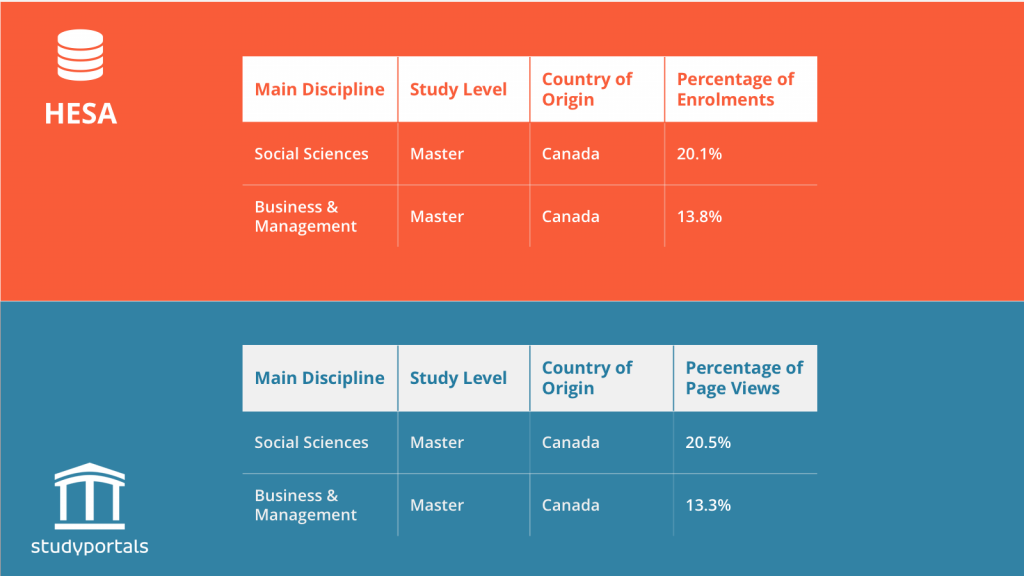
To this end, we convert the percentages of enrolments and page views by main discipline into ranks (see Canada example below). The high-level idea is that if, for example, Social Sciences has #1 rank in terms of enrolments it ideally also has a rank of #1 in terms of page views. The more these ranks match up, the higher the rank correlation will be in the end.
Conclusion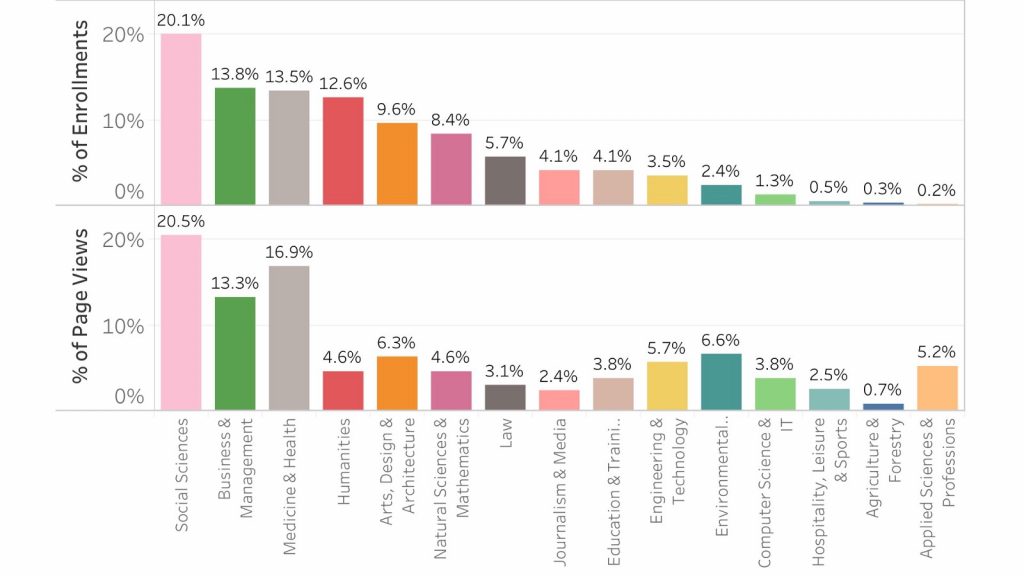

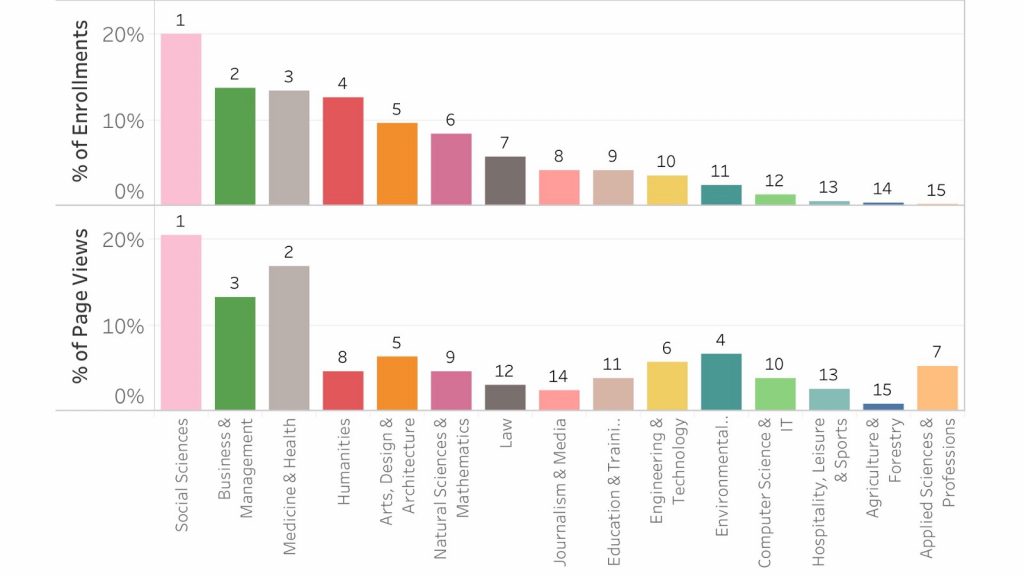
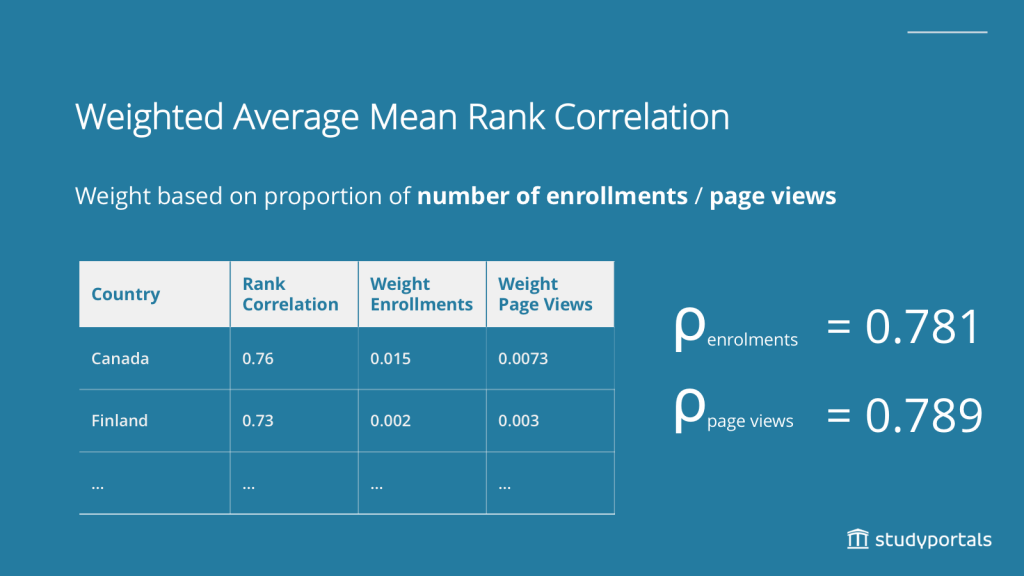
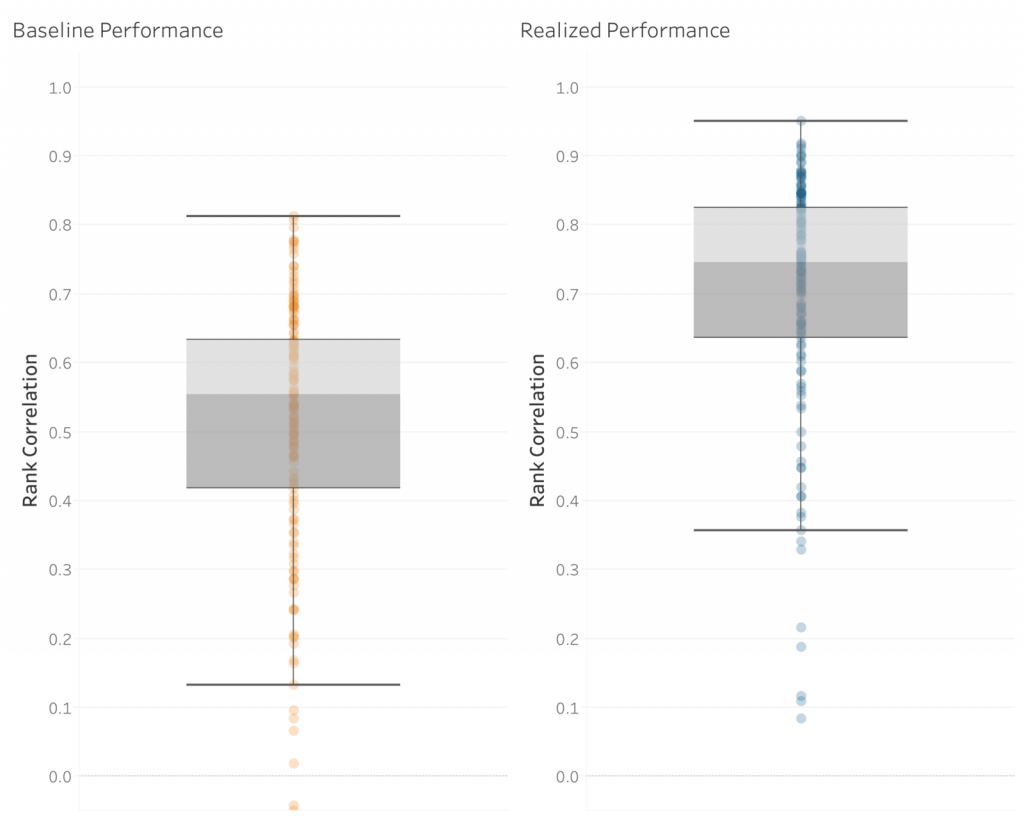
After the rank correlation has been calculated for each of the countries, we find a weighted average value of 0.79. Based on this result and the comparison to the baseline model (see technical details below) we can conclude that Studyportals’ page views data is representative for international student enrolments for UK Master’s degrees to a great extent.
Frequently Asked Questions
If you need a refresher on some of our statistical lingo, this might be helpful:
How do you define a “baseline model”?
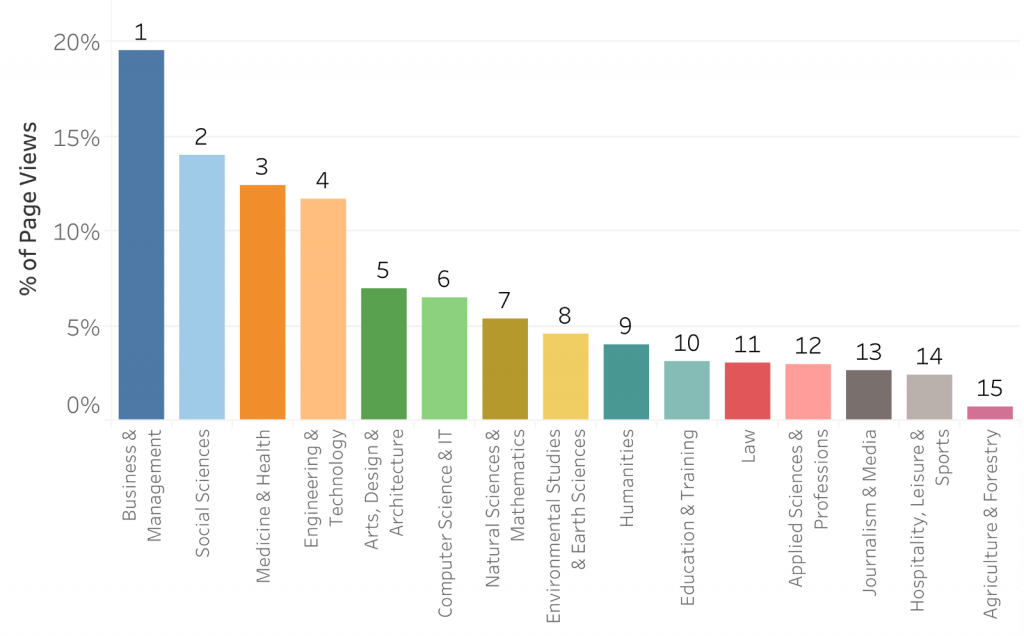
In quantitative fields (e.g. Machine Learning) a baseline model is oftentimes used to assess the model performance. In particular, the “added value” compared to the starting point (i.e. baseline) is considered. In a way, it’s an indication of how much a given KPI (rank correlation in this case) improves as a result of a certain configuration. For the baseline model, we have assumed that the page views rank is independent of the country of origin. That is to say, for every country we suppose that Business & Management has rank 1, Social Sciences has rank 2, etc. Consequently, we find that the performance on the basis of Studyportals’ page views data (right) is significantly higher than the baseline performance (left).
 Why Spearman’s Rank Correlation?
Both page views and enrolment data do not follow a normal distribution (see pictures below) and thus do not satisfy the assumptions of the Pearson Correlation. Spearman’s Rank Correlation, however, does not require a normally distributed dependent variable. Absolute Number of Page Views (top) and Enrolments (bottom) by Discipline By Country (both distributions are heavily right skewed). This also becomes clear from the corresponding Shapiro-Wilk p-value of 2e-16 for both dimensions. This implies that we reject the null hypothesis of having a normal distribution.
How much does the enrolment and page views rank differ across countries?
In general, there is much variation between countries (mean Interquartile Range=3.8; i.e. the grey box or the distance between the 25 and 75 percentile). A few exceptions to that rule are the following disciplines: “Business & Management”, “Social Sciences” and “Applied Sciences & Professions” (for all: IQR=2). This implies that for those disciplines the ranking between countries is rather constant.
How did you calculate the Rank Correlation for all countries?
At first, the rank correlation has been computed for all countries separately. Then, each country has been assigned a weight based on the absolute number of enrolments (orange) or page views (brown). In other words, countries with more page views and enrolments.
For more updates, follow us!


