Page Views and Enrolments: How Strong Is the Correlation?
Not all data are equally useful. Many enrolment datasets provide a backward-looking perspective on higher education demand. They do not reveal future trends in higher education So how do we know that Studyportals pageviews data is representative of real-world higher education demand? And how do we know page views are a predictor of future enrolments? The short answer: we know because we’ve run the numbers. We’ve established a strong correlation between Studyportals data and enrolments 12-24 months into the future, time and time again.
Our latest internal report shows Studyportals pageviews data is highly correlated with HESA enrolment data. This paper found a 0.921 rank correlation on the country level and a 0.836 rank correlation on the institution level. These results are in line with past findings. Studyportals is able to track the enrolments of the future, in real-time. You can read the full analysis below:
Introduction
In short, the following report aims to determine whether the Studyportals pageviews data is representative of real-world higher education demand. ACT clients often ask whether a program’s pageviews is linked to its enrolments. The end of the report discusses some insights that can be shared with clients to address their pageview concerns. The following analysis has been carried out using data from 2019/2020. Institutions across different countries are part of the sample.
To summarize, correlation measures the strength of association between two variables and the direction of the relationship. The value of the correlation coefficient is between +1 and -1. A value of ±1 indicates a perfect degree of association between two variables. As the coefficient value approaches 0, the strength of the association is weaker.
Methodology
The correlation was calculated on two levels to determine whether Studyportals pageview data accurately reflects higher education demand. More specifically, this report estimates the correlation between Studyportals pageview data and HESA enrolment data.
The correlation was calculated on different levels for validation. If the correlation is high on the university and country levels, a client may be more convinced.
This analysis has been performed before on the discipline level. However, both Studyportals and HESA datasets contain more institutions than disciplines. Because more institutions exist than disciplines, it is less likely for the correlation to be higher on the institution level than the discipline level. For correlation to be high on the institution level, all institutions need to be ranked similarly in terms of Studyportals pageviews and HESA enrolments. Hence, this approach is a more robust way of checking whether pageviews reflect higher education demand.
Moreover, competitor analysis is an integral part of ACT’s value proposition. Clients use university-level insights to inform their strategic decisions. For example, a client may think the following:
“University x’s pageviews have increased by 10% over the past year so enrolments will be 10% higher”
To determine whether such claims are valid, we must identify whether University-level pageview data is accurate.
Moreover, the correlation was calculated using absolute pageviews and enrolments. Previously, interns have used relative pageviews and enrolments. Correlation is the same whether you adopt absolute or relative values. Secondly, since country-level and institution-level samples consist of over 20 observations, Spearman correlation is appropriate. In addition, countries/institutions which were three standard deviations away from the mean in terms of page views were dropped. Also, China was dropped such that the sample is representative.
Interpreting Spearman Correlation
The Spearman correlation coefficient is the second most popular correlation measurement after Pearson’s R. Spearman’s correlation coefficient is just Pearson’s R, reformulated using variable ranks instead of raw values.
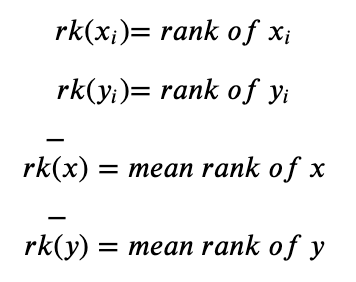
Mathematically, Spearman correlation is expressed in the following manner:
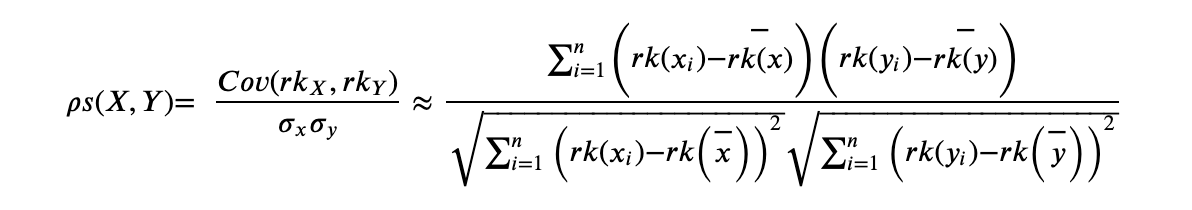
Where:
Assumptions:
- Pairs of observations are independent
- Two variables should be measured on an ordinal, interval or ratio scale
- It assumes that there is a monotonic relationship between the two variables
Interpreting Kendall’s Tau
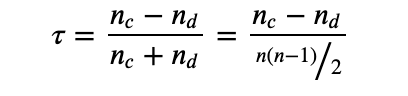
Under normal circumstances, Kendall correlation is more robust than Spearman correlation. Kendall is preferred for small sample sizes. Kendall is also preferred when there are outliers.
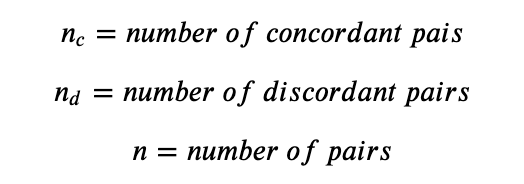
Mathematically, Kendall’s Tau is expressed the following way:
Where:
Assumptions:
Kendall rank correlation makes the same assumptions as Spearman.
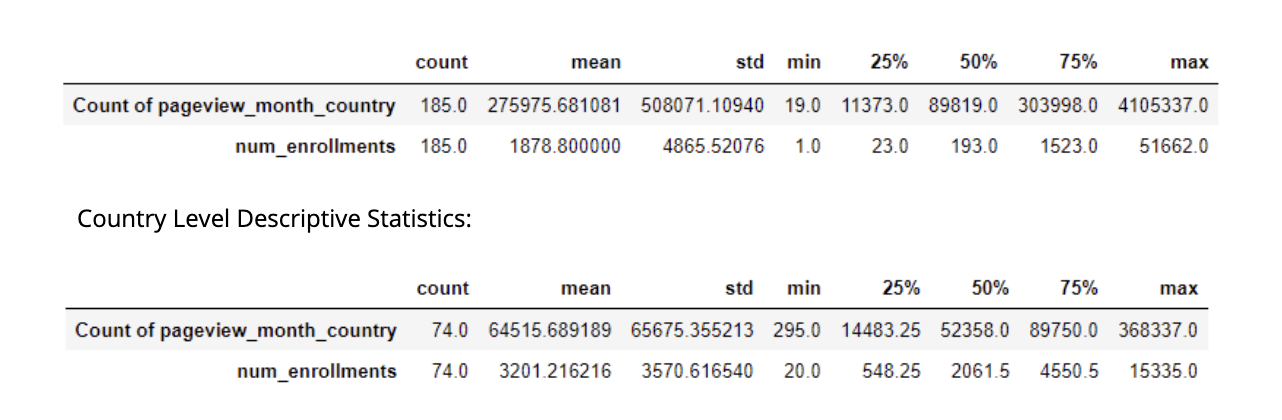
Exploratory Data Analysis
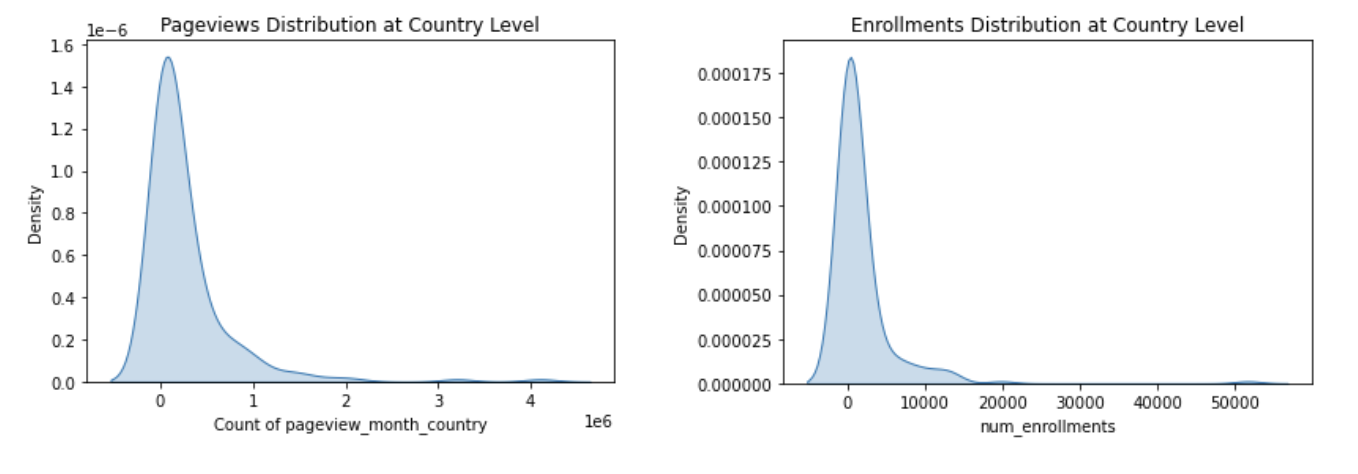
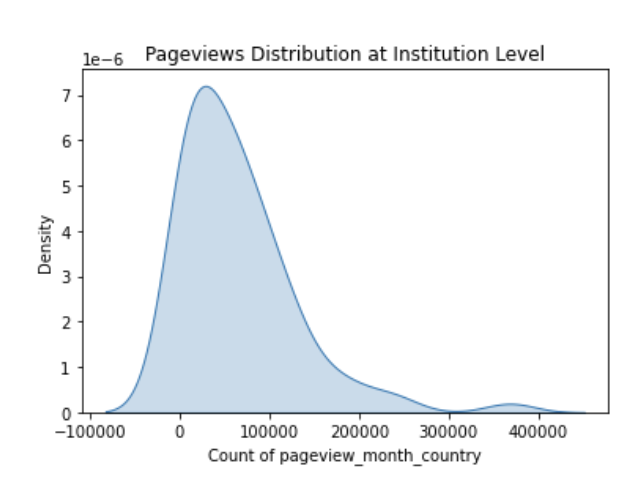
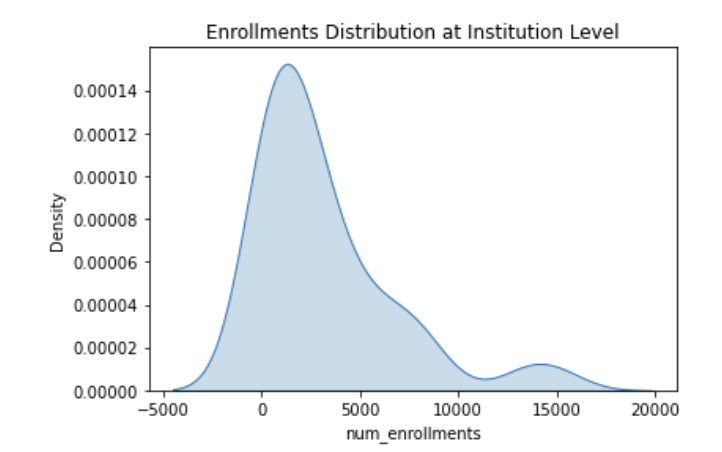
The following visualizations show whether the data follows a normal distribution or not. The frequency distributions show that data is skewed to the right for both enrolments and pageviews.
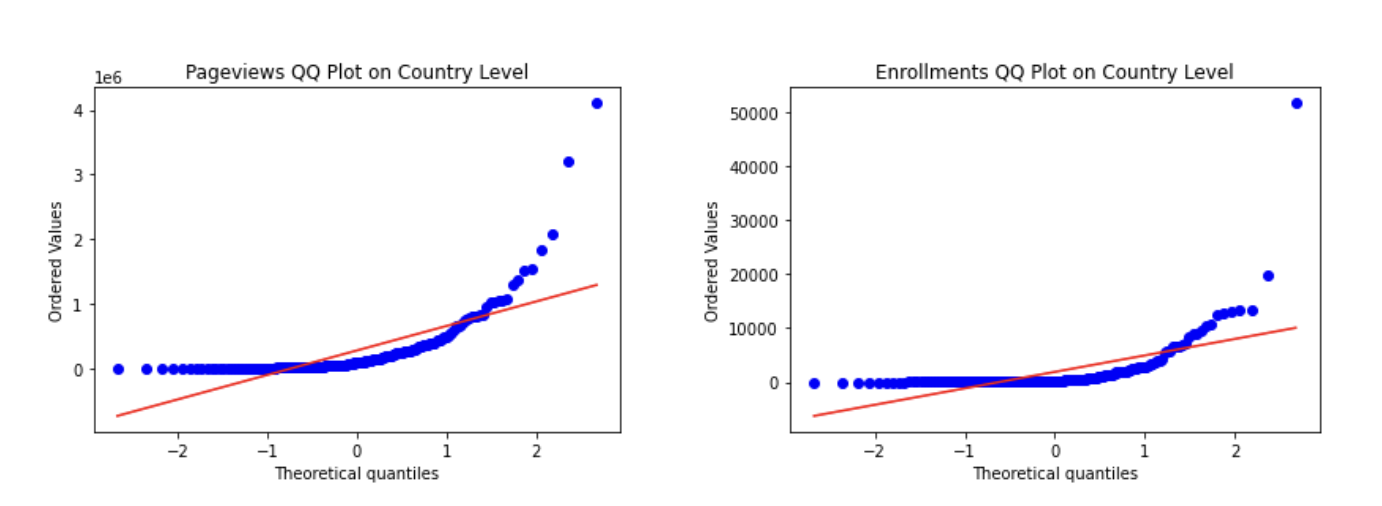
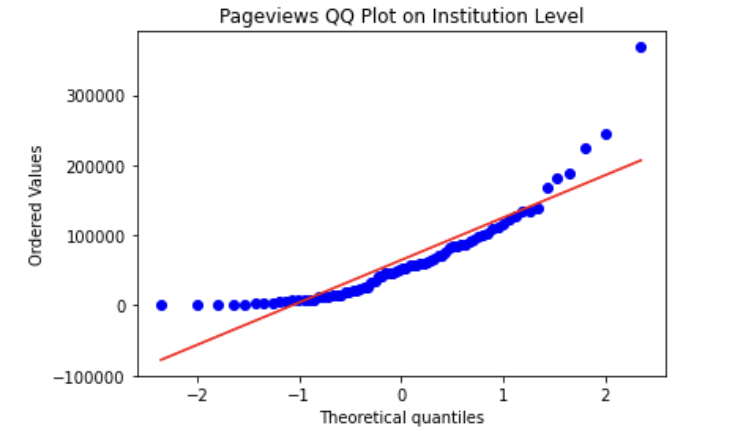
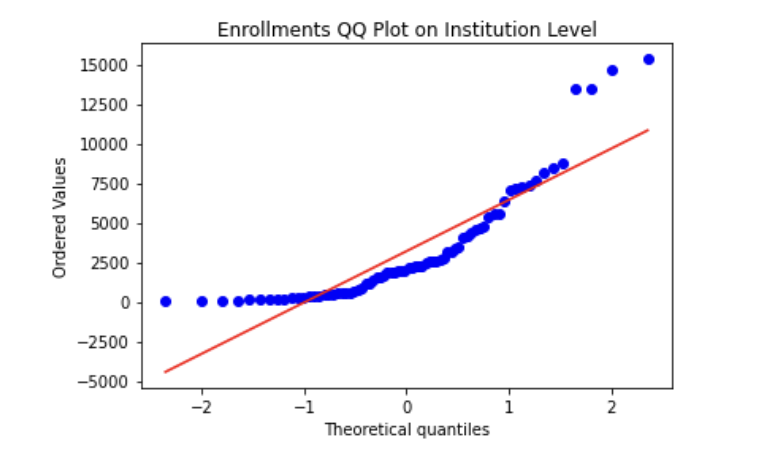
Quantile-Quantile (or QQ) plots are often used to check for normality. If a sample is normally distributed, points should be located across the straight red line. The rationale behind the plot is the following: if the distributions are identical, then the quantiles should be approximately equal. The QQ plot also shows that both enrolments and pageviews are right-skewed since all graphs are convex.
Country Level:
Institution Level:
Results
On the country level (2019/2020):
Spearman Correlation=0.921, n=181
Kendall=0.756, n=181
On the institution level (2019/2020):
Spearman Correlation=0.836, n=73
Kendall = 0.649, n=73
Conclusion & Comparison With Past Findings
Past results include the following:
Rutger R. 2014 NUFFIC data: Spearman Correlation = 0.70, n=74 (on institution level)
Robert L. 2015 NUFFIC data: Spearman Correlation = 0.855, n=? (on country level)
Roy K.B. 2017/18 HESA data: Spearman Correlation = 0.82, n=120 (on discipline level)
Sophie L. 2018/19 HESA data: Spearman Correlation = 0.81, n=123 (on discipline level)
Studyportals pageviews data is highly correlated with HESA enrolment data. This paper found a 0.921 rank correlation on the country level and a 0.836 rank correlation on the institution level. These results are in line with past findings. The fact that enrolments and pageviews are correlated on the institution, country, and discipline level means that these correlations likely aren’t spurious (https://www.tylervigen.com/spurious-correlations). Spurious correlation refers to a connection between two variables that exist by chance.
Author: Robert-Jan Bodewes
For more updates, follow us!